Fourth Quarter - Week 1 LC1
Background Information:
Statistics plays a vital role in the lives of many. It can be used in different aspects of life such as helping us to ensure our safety, improve our health, and advance our knowledge.
Fourth Quarter - Week 3
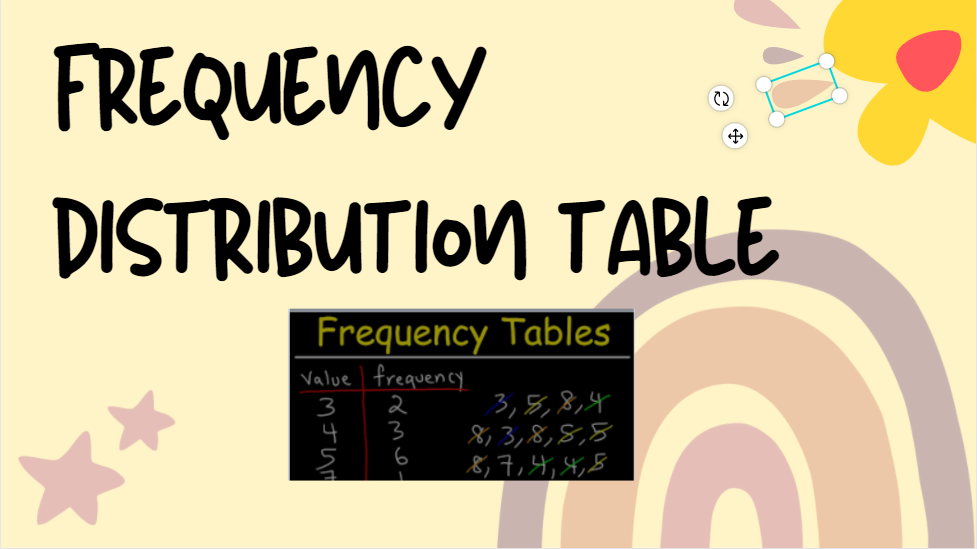
What is a Frequency Distribution Table?
Frequency tells you how often something happened. The frequency of an observation tells you the number of times the observation occurs in the data. For example, in the following list of numbers, the frequency of the number 9 is 5 (because it occurs 5 times):
1, 2, 3, 4, 6, 9, 9, 8, 5, 1, 1, 9, 9, 0, 6, 9.
Tables can show either categorical variables (sometimes called qualitative variables) or quantitative variables (sometimes called numeric variables). You can think of categorical variables as categories (like eye color or brand of dog food) and quantitative variables as numbers.
STATISTICS and PROBABILITY
Mathematics from K-10 is a skills subject. By itself, it is all about quantities, shapes and figures, functions, logic, and reasoning. Mathematics is also a tool of science
and a language complete with its own notations and symbols and “grammar” rules, with which concepts and ideas are effectively expressed.
The contents of mathematics include Numbers and Number Sense, Measurement, Geometry, Patterns & Algebra and Statistics and Probability.
Numbers and Number Sense as a strand include concepts of numbers, properties, operations, estimation, and their applications.
Measurement as a strand includes the use of numbers and measures to describe, understand, and compare mathematical and concrete objects. It focuses on
attributes such as length, mass and weight, capacity, time, money, and temperature, as well as applications involving perimeter, area, surface area, volume, and angle
measure.
Geometry as a strand includes properties of two- and three-dimensional figures and their relationships, spatial visualization, reasoning, and geometric modelling and
proofs.
Patterns and Algebra as a strand studies patterns, relationships, and changes among shapes and quantities. It includes the use of algebraic notations and
symbols, equations, and most importantly, functions, to represent and analyze relationships.
Statistics and Probability as a strand is all about developing skills in collecting and organizing data using charts, tables, and graphs; understanding, analyzing and
interpreting data; dealing with uncertainty; and making predictions about outcomes.
The K to 10 Mathematics Curriculum provides a solid foundation for Mathematics at Grades 11 to 12. More importantly, it pro vides necessary concepts and life
skills needed by Filipino learners as they proceed to the next stage in their life as learners and as citizens of the Philippines.